
I’ve been using an awesome tool for a while, and I haven’t heard a lot of #sqlfamily talk about it so I knew I had to put out a blog about it. The tool I’m talking about is ClearTrace and it’s used to normalize and aggregate the data from a SQL Profiler trace. I know, I know, we should all be using XE (Extended Events), sorry Erin Stellato(t), but I still deal with a lot of customers who have SQL 2008/R2 instances, so this makes my life a lot easier.
This tool makes it really really easy to analyze trace data and find out where your resources are being spent.
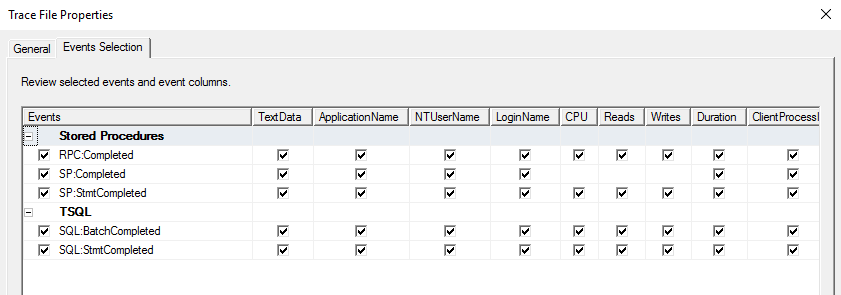
We’ll get a trace set up against the AdventureWorks2012 database using the following trace properties…
And here is the sample workload we’ll execute while the trace is running.
EXECUTE [dbo].[uspGetBillOfMaterials] @StartProductID = 680 ,
@CheckDate = '1/1/2005'
GO
EXECUTE [dbo].[uspGetBillOfMaterials] @StartProductID = 722 ,
@CheckDate = '1/1/2005'
GO
EXECUTE [dbo].[uspGetBillOfMaterials] @StartProductID = 723 ,
@CheckDate = '1/1/2005'
GO
EXECUTE [dbo].[uspGetManagerEmployees] @BusinessEntityID = 5
GO
EXECUTE [dbo].[uspGetEmployeeManagers] @BusinessEntityID = 5
GO
EXECUTE [dbo].[uspGetManagerEmployees] @BusinessEntityID = 55
GO
EXECUTE [dbo].[uspGetEmployeeManagers] @BusinessEntityID = 55
GO
EXECUTE [dbo].[uspGetManagerEmployees] @BusinessEntityID = 150
GO
EXECUTE [dbo].[uspGetEmployeeManagers] @BusinessEntityID = 150
GO
EXECUTE [dbo].[uspGetManagerEmployees] @BusinessEntityID = 1
GO
EXECUTE [dbo].[uspGetEmployeeManagers] @BusinessEntityID = 1
GO
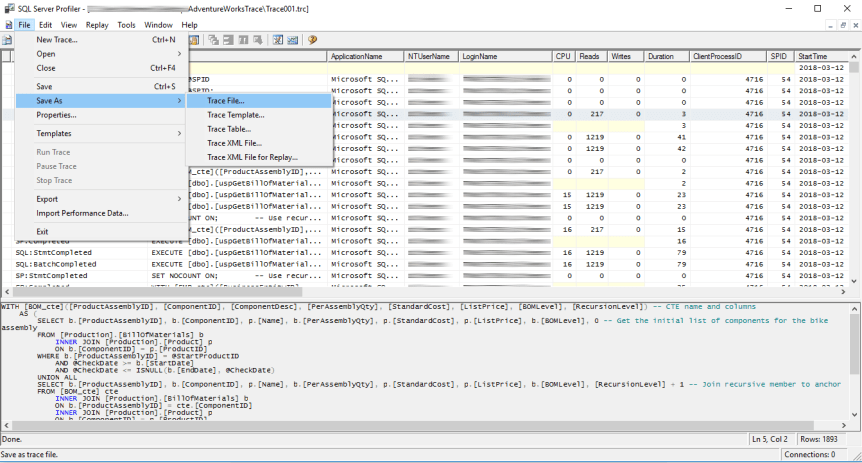
Once the SQL is done executing, save the trace file.
Now we’ll move on to the fun stuff.


And select the Import Files button. Note: If your trace consists of multiple files due to file size cutoff, ClearTrace will import all of them if they’re in the folder.
Once the trace file has been imported, you will see the 3 stored procs that were executed, along with the count of executions and aggregations of CPU, Reads, Writes, and Duration. If you’d like to see averages, check the box.

This info is very helpful, but we’re looking at Batches and since stored procs can contain a lot of code, it’s helpful to drill into the individual statement executions. When we change the event selection to Statements, we get a more granular view into our trace data

At any time when looking at Batches or Statements, we can double-click on a cell and get the Text Data Detail.

I hope you found this post helpful, I look forward to doing a few more HandyTools blog posts.

One thought on “Handy Tool – ClearTrace”